User Experience: Dealing with user waiting time

I really liked this talk about time ! From a UX Design perspective, it means you have to manage the active and passive phases of the user during the usage of  a website, an app: initialization, startup, loading time, rendering time. Behavioral patterns discovered in real life are implemented in UI design to offer the most UX friendly apps. The trend mobile-first pushes the optimization to load what is important first and deliver the user from a long waiting time. Why would you need to wait more than what the browser can possibly render, the reminder being loaded behind the scene.

Managing the user experience during the transition phases requires also a lot of data on the usage of a website or an app to act where there are opportunities to improve the UX. These optimizations are necessary for apps with important volume of data (eCommerce, eBanking, news, stream). A good example, ATMs have nowadays transition screens delivering information on the bank services & products while making you wait for your cash when you withdraw money…

There are plenty of other talks on this JSConf channel that are worth to watch 🙂

LiveCoding TV

It was only a matter of time before coders broadcast live their tutorials. Because the audience can’t reasonnably attend to all the conferences & developers’ events across the world or follow the pace of new tech release… Between youtube, tuts, coding tuts websites, meetups, a tv is a complementary source/channel to capture and share knowledge. Geek is a lifestyle after all 🙂

https://www.livecoding.tv/

Animated Earth with wind, weather, ocean condition in SVG

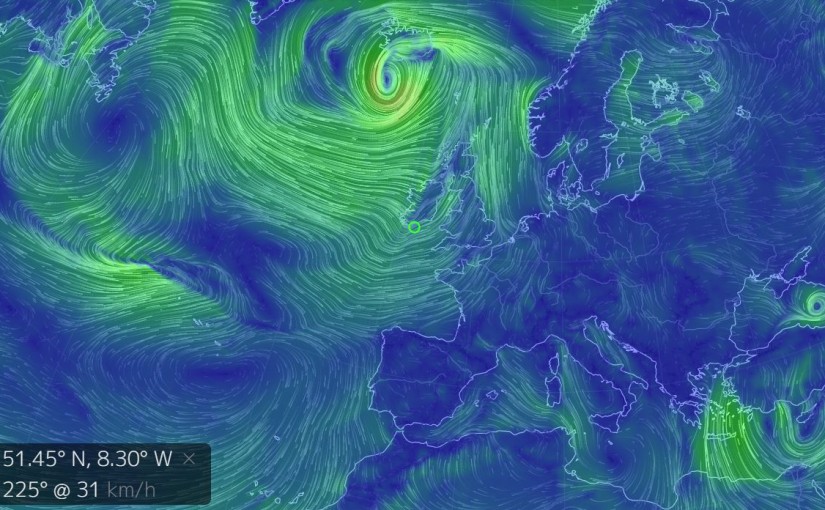
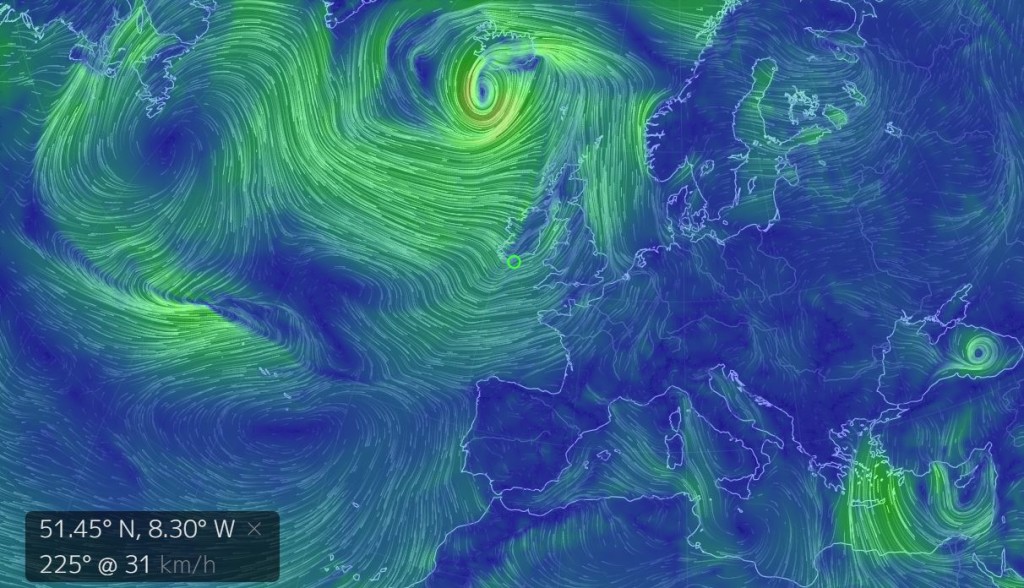
I discovered this crazy – in an awesome way – website that is a pure gem regarding the potential of knowledge acquisition thanks to data visualization. Playful with a lot of options, though intuitive. The rendering of the all the currents and air streams on the exposed part of the globe is fast but for better UX a powerful computer is recommended.

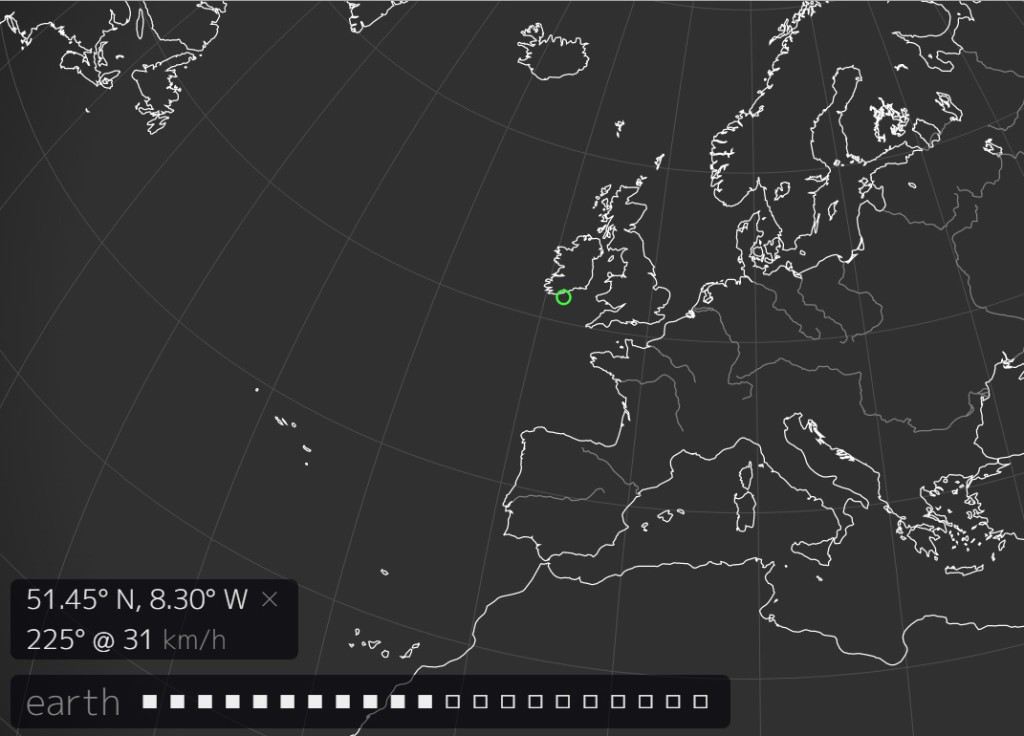
Few screenshots of the website I made to illustrate this post:

3 quick ways to ‘hack’ the website and the information it provides:

  • extend the library of human-traceable data: A lot of things could be added to this map basically like fligth/car/ship/internet traffic, animals’ (incl. humans’) migrations, cellphones, pollutions (all kinds), air quality, sea/water/… quality, temperatures, rain levels
  • Deploy it at a city scale to acquire data and take measure to improve infrastructures, traffic, …
  • mash them on to find if correlations can be found or if simulation models can be improved… – economists and politics would be interested.

Plenty of possibilities made available through a not so known tech called SVG become more popular with the adoption of the HTML5 standard.

Creator is on twitter: https://twitter.com/cambecc